

symbolica-mcp
★ 10from YuChenSSR
A scientific computing server for symbolic math, data analysis, and visualization using popular Python libraries like NumPy, SciPy, and Pandas.
symbolica-mcp
A scientific computing Model Context Protocol (MCP) server allows AI, such as Claude, to perform symbolic computing, conduct calculations, analyze data, and generate visualizations. This is particularly useful for scientific and engineering applications, including quantum computing, all within a containerized environment.
Features
- Run scientific computing operations with NumPy, SciPy, SymPy, Pandas
- Perform symbolic mathematics and solve differential equations
- Support for linear algebra operations and matrix manipulations
- Quantum computing analysis
- Create data visualizations with Matplotlib and Seaborn
- Perform machine learning operations with scikit-learn
- Execute tensor operations and complex matrix calculations
- Analyze data sets with statistical tools
- Cross-platform support (automatically detects Windows, macOS, and Linux), especially for users with Mac M series chips
- Works on both Intel/AMD (x86_64) and ARM processors
Examples
Tensor Products
Can you calculate and visualize the tensor product of two matrices? Please run:

import numpy as np
import matplotlib.pyplot as plt

# Define two matrices
A = np.array([[1, 2],
              [3, 4]])
B = np.array([[5, 6],
              [7, 8]])

# Calculate tensor product using np.kron (Kronecker product)
tensor_product = np.kron(A, B)

# Display the result
print("Matrix A:")
print(A)
print("\nMatrix B:")
print(B)
print("\nTensor Product A ⊗ B:")
print(tensor_product)

# Create a visualization of the tensor product
plt.figure(figsize=(8, 6))
plt.imshow(tensor_product, cmap='viridis')
plt.colorbar(label='Value')
plt.title('Visualization of Tensor Product A ⊗ B')
Symbolic Mathematics
Can you solve this differential equation? Please run:
import sympy as sp
import matplotlib.pyplot as plt
import numpy as np

# Define symbolic variable
x = sp.Symbol('x')
y = sp.Function('y')(x)

# Define the differential equation: y''(x) + 2*y'(x) + y(x) = 0
diff_eq = sp.Eq(sp.diff(y, x, 2) + 2*sp.diff(y, x) + y, 0)

# Solve the equation
solution = sp.dsolve(diff_eq)
print("Solution:")
print(solution)

# Plot a particular solution (C1=1, C2=0)
solution_func = solution.rhs.subs({sp.symbols('C1'): 1, sp.symbols('C2'): 0})
print("Particular solution:")
print(solution_func)

# Create a numerical function we can evaluate
solution_lambda = sp.lambdify(x, solution_func)

# Plot the solution
x_vals = np.linspace(0, 5, 100)
y_vals = [float(solution_lambda(x_val)) for x_val in x_vals]

plt.figure(figsize=(10, 6))
plt.plot(x_vals, y_vals)
plt.grid(True)
plt.title("Solution to y''(x) + 2*y'(x) + y(x) = 0")
plt.xlabel('x')
plt.ylabel('y(x)')
plt.show()
Data Analysis
Can you perform a clustering analysis on this dataset? Please run:

import numpy as np
import pandas as pd
import matplotlib.pyplot as plt
from sklearn.cluster import KMeans
from sklearn.preprocessing import StandardScaler

# Create a sample dataset
np.random.seed(42)
n_samples = 300

# Create three clusters
cluster1 = np.random.normal(loc=[2, 2], scale=0.5, size=(n_samples//3, 2))
cluster2 = np.random.normal(loc=[7, 7], scale=0.5, size=(n_samples//3, 2))
cluster3 = np.random.normal(loc=[2, 7], scale=0.5, size=(n_samples//3, 2))

# Combine clusters
X = np.vstack([cluster1, cluster2, cluster3])

# Create DataFrame
df = pd.DataFrame(X, columns=['Feature1', 'Feature2'])
print(df.head())

# Standardize data
scaler = StandardScaler()
X_scaled = scaler.fit_transform(X)

# Apply KMeans clustering
kmeans = KMeans(n_clusters=3, random_state=42)
df['Cluster'] = kmeans.fit_predict(X_scaled)

# Plot the clusters
plt.figure(figsize=(10, 6))
for cluster_id in range(3):
    cluster_data = df[df['Cluster'] == cluster_id]
    plt.scatter(cluster_data['Feature1'], cluster_data['Feature2'],
                label=f'Cluster {cluster_id}', alpha=0.7)

# Plot cluster centers
centers = scaler.inverse_transform(kmeans.cluster_centers_)
plt.scatter(centers[:, 0], centers[:, 1], s=200, c='red', marker='X', label='Centers')

plt.title('K-Means Clustering Results')
plt.xlabel('Feature 1')
plt.ylabel('Feature 2')
plt.legend()
plt.grid(True)
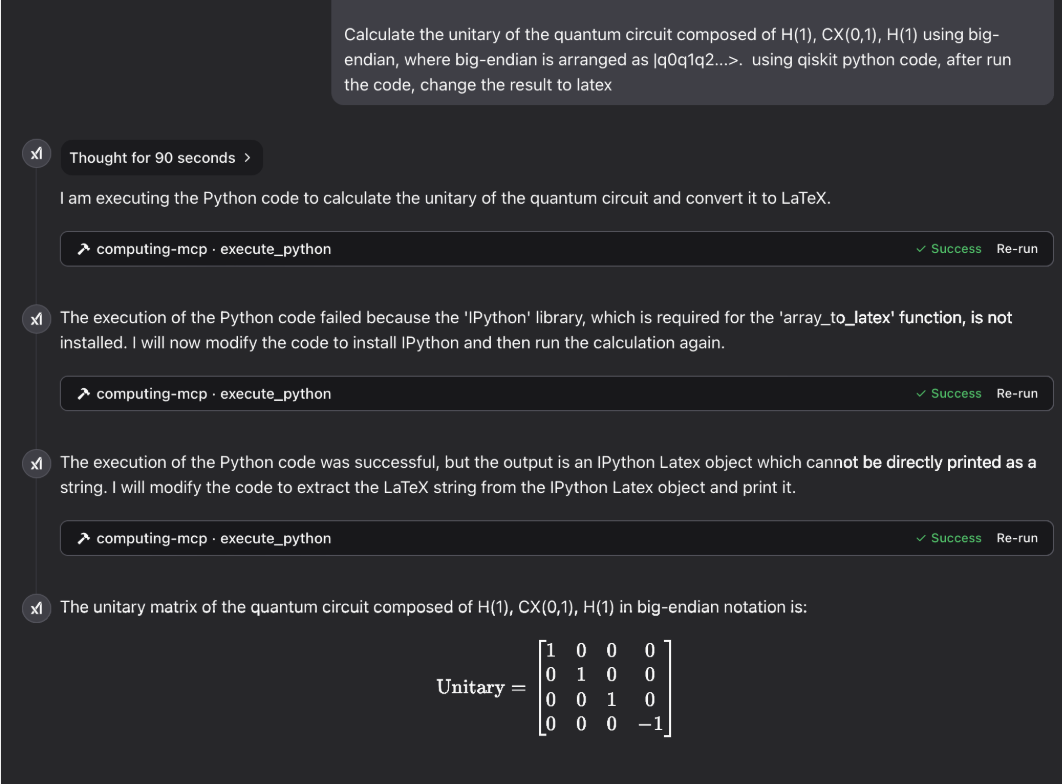
Quantum Computing
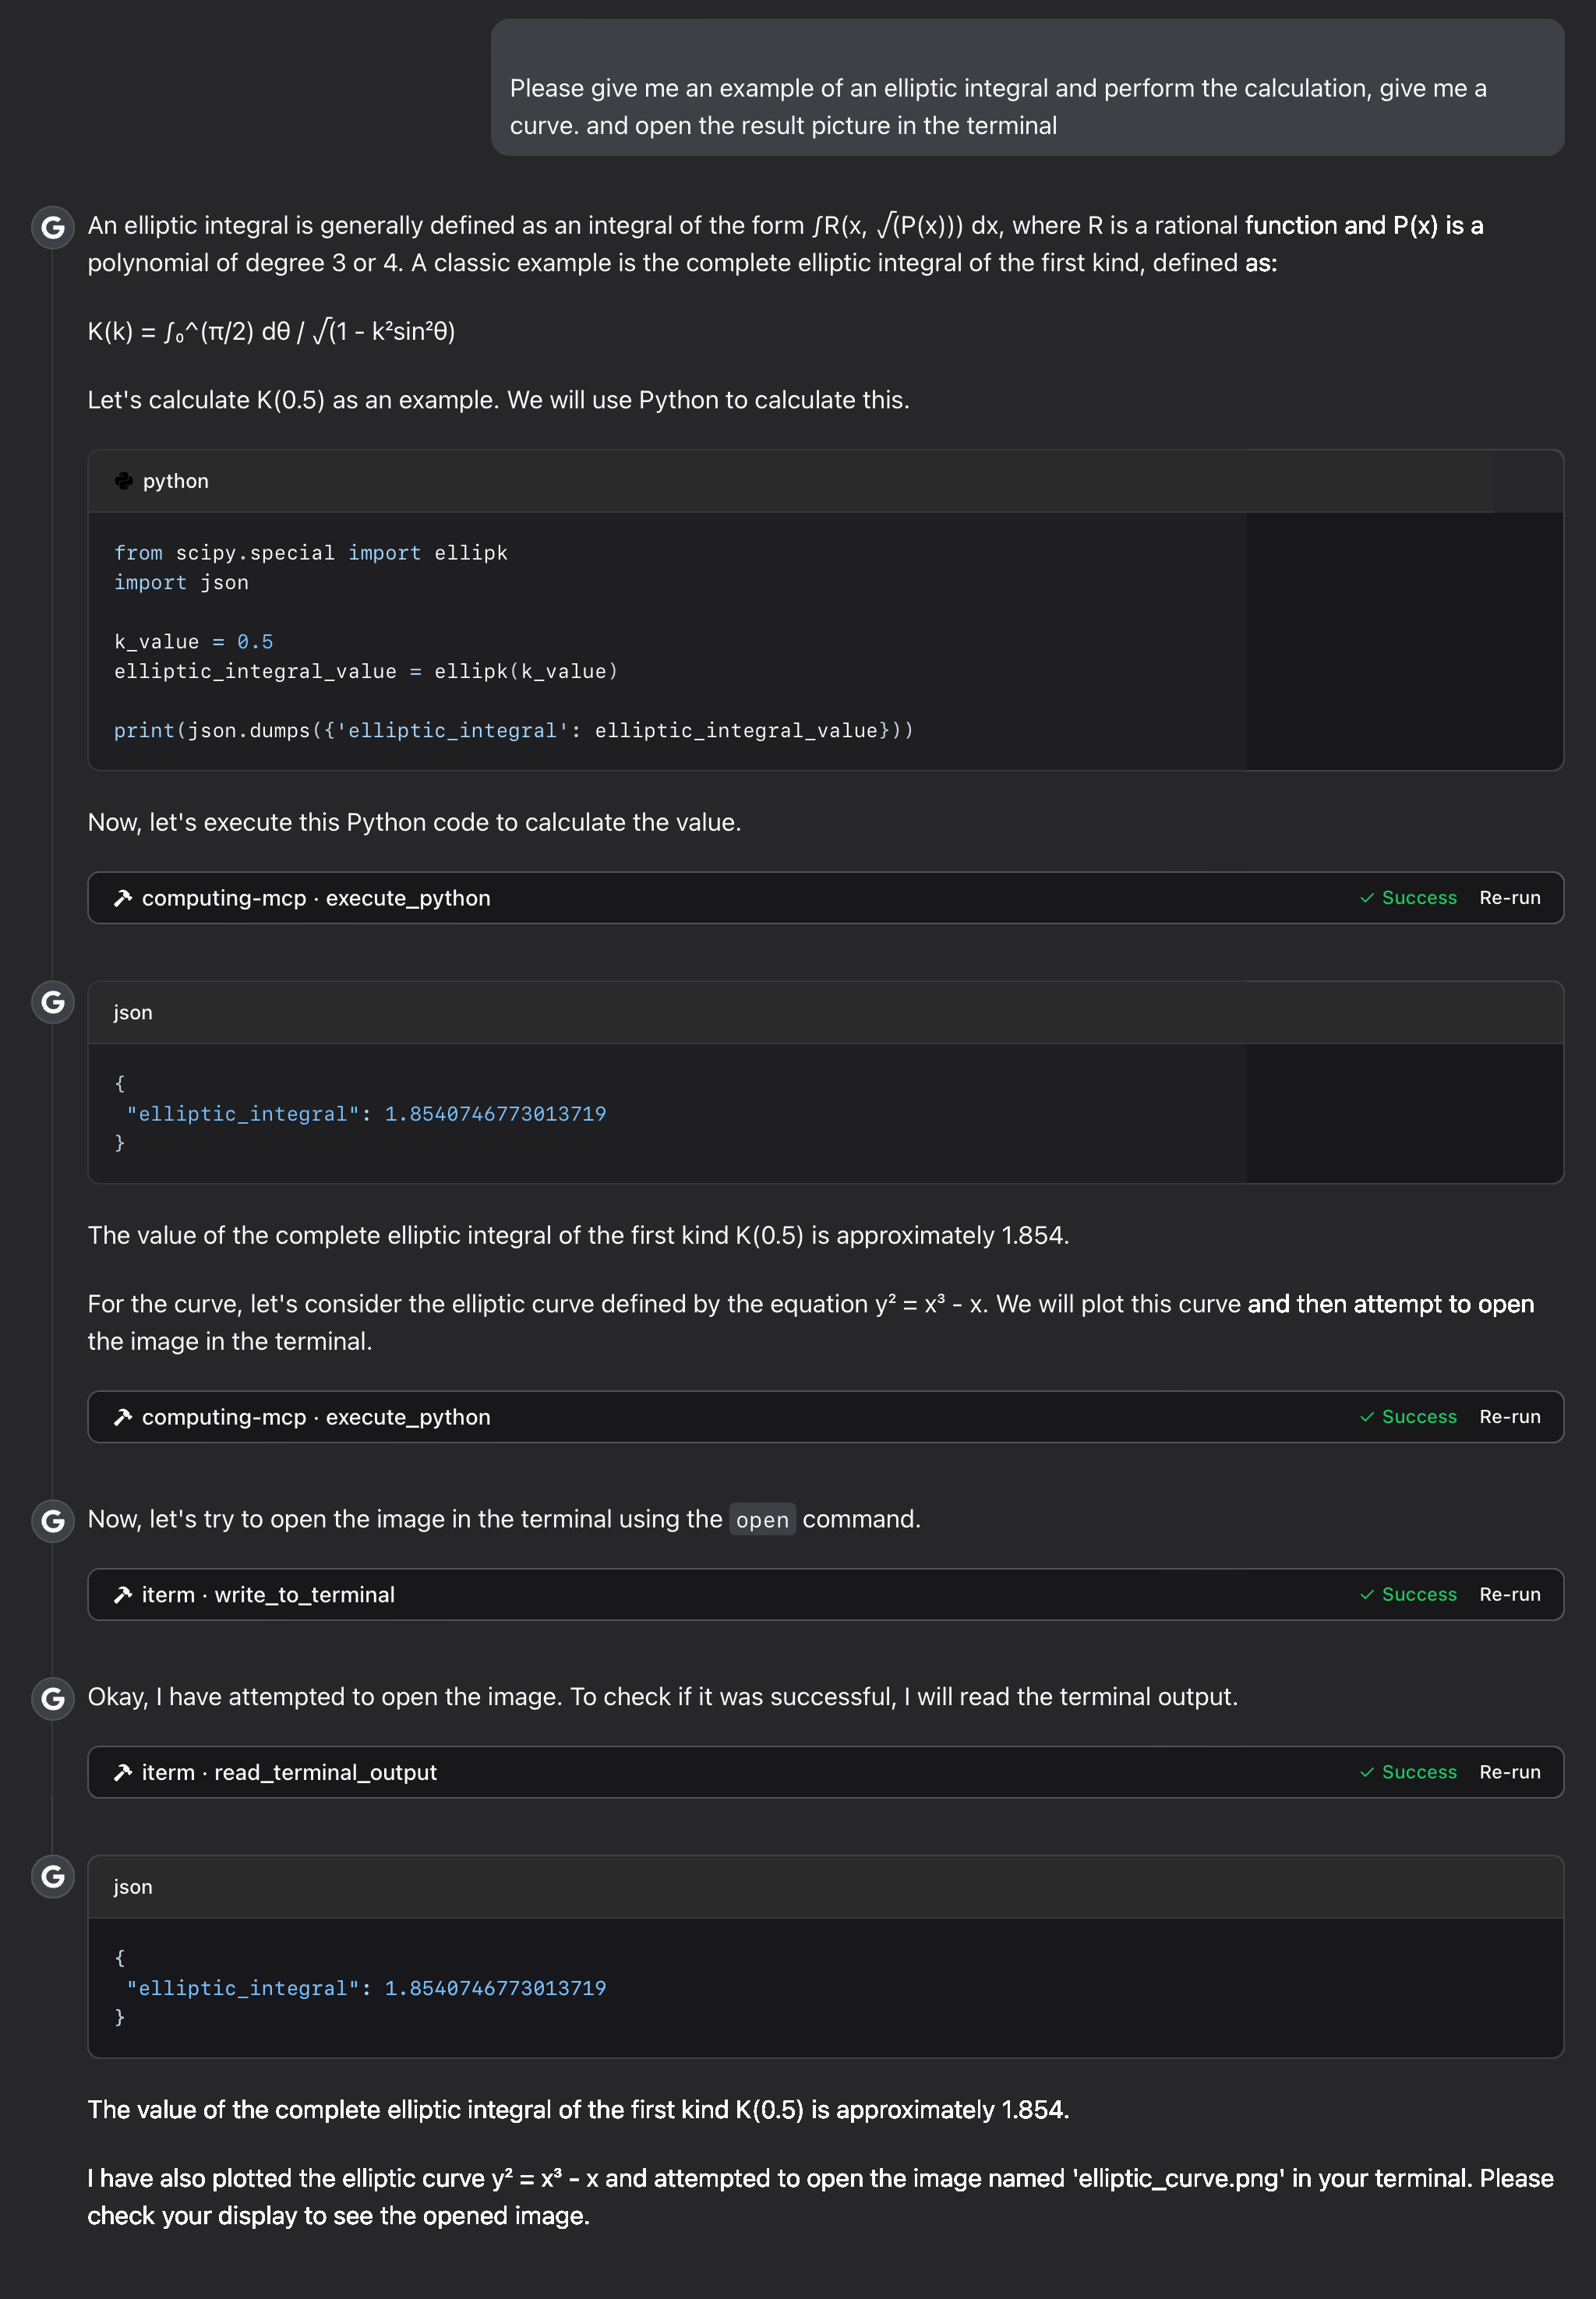
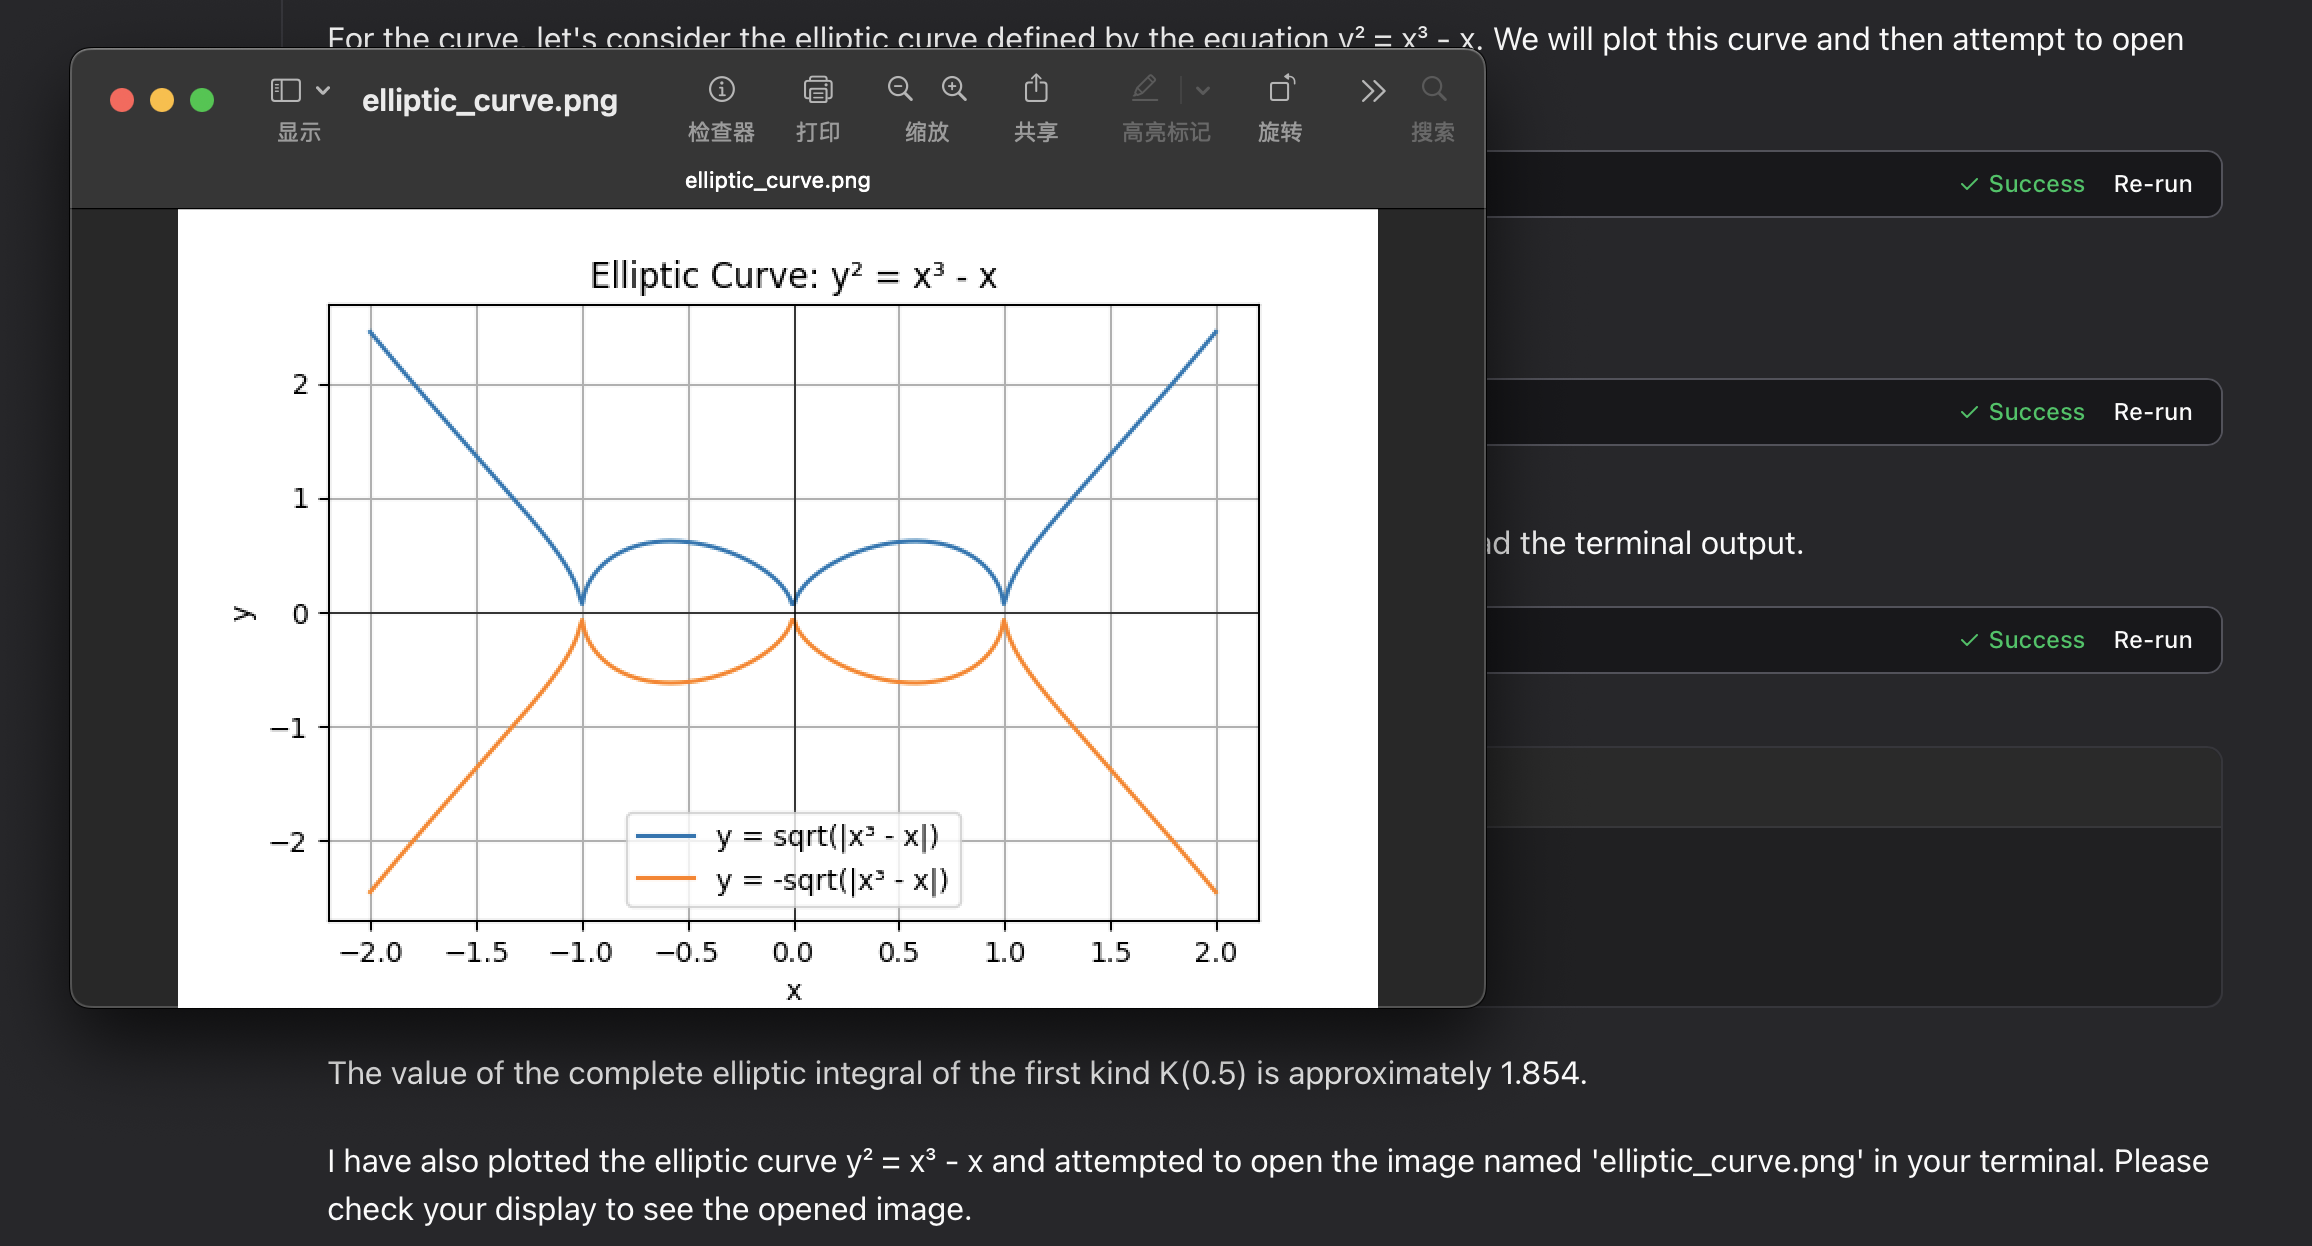
Gallery
laser physics:

elliptic integral:
# Pull the image from Docker Hub
docker pull ychen94/computing-mcp:latest

# Run the container (automatically detects host OS)
docker run -i --rm -v /tmp:/app/shared ychen94/computing-mcp:latest
Quick Start
Using the Docker image
# Pull the image from Docker Hub
docker pull ychen94/computing-mcp:latest

# Run the container (automatically detects host OS)
docker run -i --rm -v /tmp:/app/shared ychen94/computing-mcp:latest
For Windows users:
docker run -i --rm -v $env:TEMP:/app/shared ychen94/computing-mcp:latestIntegrating with Claude for Desktop
- Open Claude for Desktop
- Open Settings ➝ Developer ➝ Edit Config
- Add the following configuration:
For MacOS/Linux:
{
  "mcpServers": {
    "computing-mcp": {
      "command": "docker",
      "args": [
        "run",
        "-i",
        "--rm",
        "-v",
        "/tmp:/app/shared",
        "ychen94/computing-mcp:latest"
      ]
    }
  }
}
For Windows:
{
  "mcpServers": {
    "computing-mcp": {
      "command": "docker",
      "args": [
        "run",
        "-i",
        "--rm",
        "-v",
        "%TEMP%:/app/shared",
        "ychen94/computing-mcp:latest"
      ]
    }
  }
}
Troubleshooting
Common Issues
-
Permission errors with volume mounts
- Ensure the mount directory exists and has appropriate permissions
-
Plot pciture files not appearing
-
Check the path in your host system:
/tmpfor macOS/Linux or your temp folder for Windows -
Verify Docker has permissions to write to the mount location
-
check the mcp tool's output content
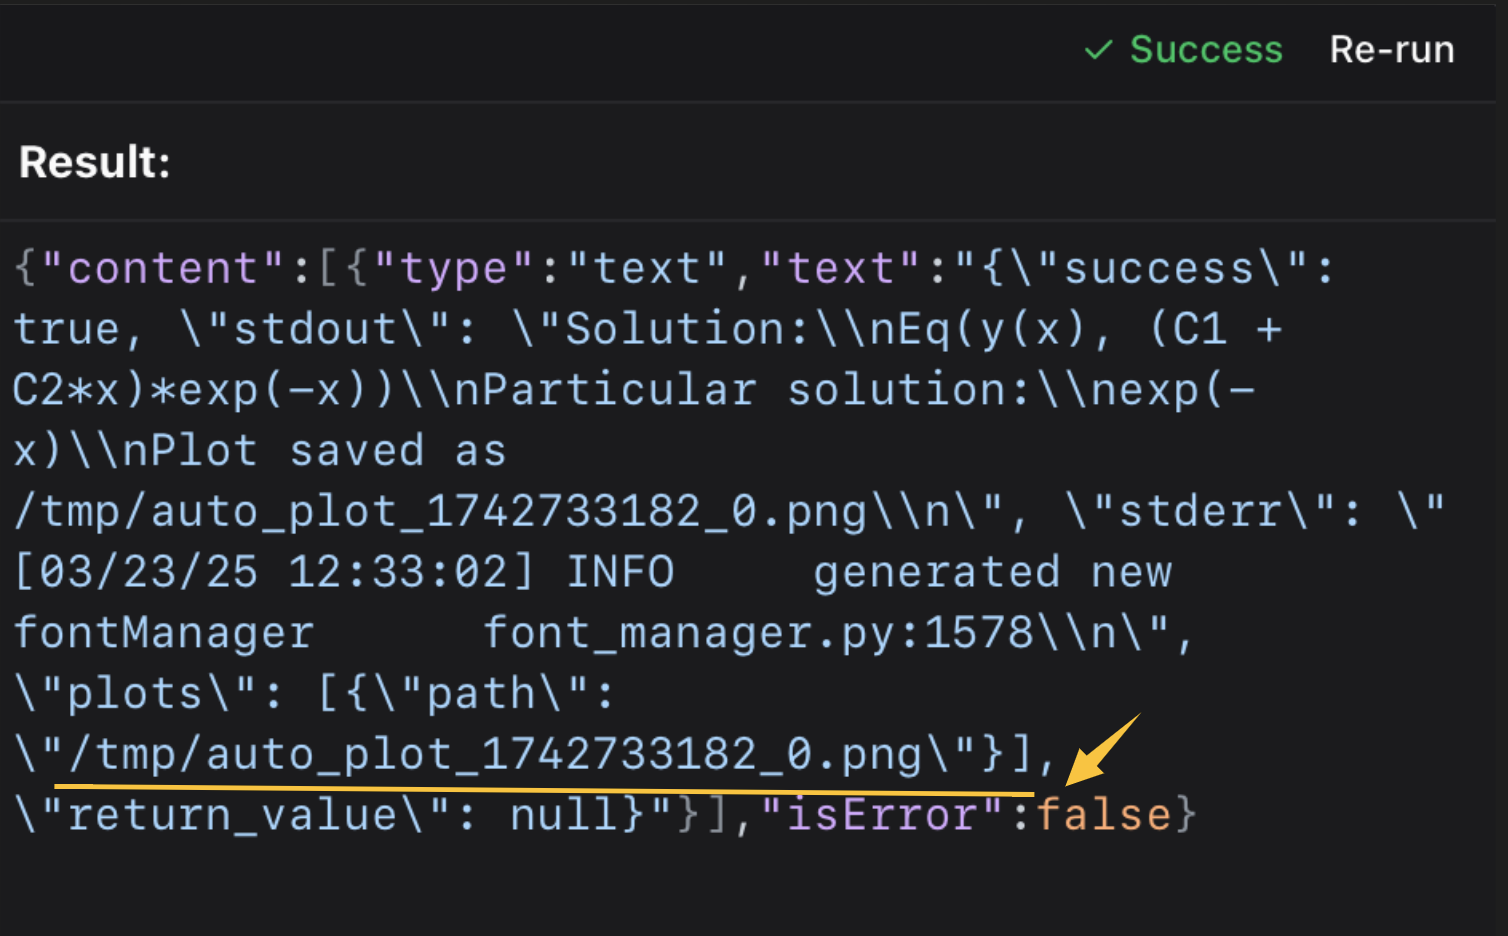 then open it in the terminal or your picture viewer.
⭐️ ⭐️ I use the iterm-mcp-server or other terminals' mcp servers to open the file without interrupting your workflow. ⭐️ ⭐️
-
Support
If you encounter issues, please open a GitHub issue with:
- Error messages
- Your operating system and Docker version
- Steps to reproduce the problem
Licensed under MIT— you can use, modify, and redistribute it under that license's terms.
License
This project is licensed under the MIT License.
For more details, please see the LICENSE file in this project repository.